Description
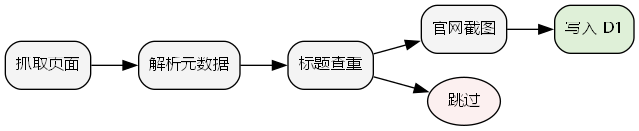
Graphviz turns a written description of relationships into a picture. You state the nodes and which one points to which in its DOT language, and the layout engines work out the positions, the routing of the edges and the direction the graph grows — no dragging boxes around a canvas.
Because the input is plain text, a diagram can live next to the code in version control: change a line, re-run the command, get the new picture. It fits anything that becomes unmanageable to draw by hand once the node count rises — dependency graphs, state machines, call chains, flows. There is no main window; it is a set of command line programs, and other tools frequently call it as their underlying drawing engine.
The DOT language: A few lines of text define nodes and edges, along with shapes, colors, fonts and clusters. Attributes control how the drawing looks, so nothing is positioned by hand.
Several layout engines: dot draws hierarchical directed graphs, neato and fdp use spring models for undirected ones, circo arranges circular layouts and twopi radial ones — the same data looks completely different depending on which you pick.
Many output formats: PNG, SVG, PDF and PostScript among others. SVG output can carry links and tooltips, so it drops straight into a web page.
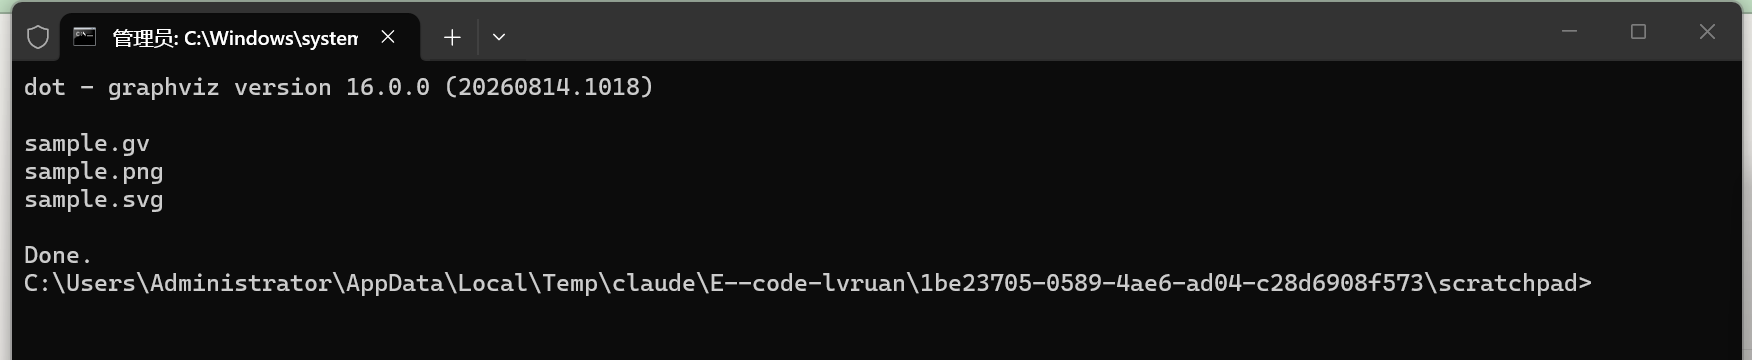
Command line driven: One dot -Tpng call produces the image, which makes it easy to wire into a build script, a docs pipeline or a Makefile so the diagrams regenerate alongside the source.
Widely embedded: Plenty of analysis and documentation tools emit a DOT file and hand it to Graphviz to render, so installing it is what completes their diagram output.
Because the input is plain text, a diagram can live next to the code in version control: change a line, re-run the command, get the new picture. It fits anything that becomes unmanageable to draw by hand once the node count rises — dependency graphs, state machines, call chains, flows. There is no main window; it is a set of command line programs, and other tools frequently call it as their underlying drawing engine.
Features
The DOT language: A few lines of text define nodes and edges, along with shapes, colors, fonts and clusters. Attributes control how the drawing looks, so nothing is positioned by hand.
Several layout engines: dot draws hierarchical directed graphs, neato and fdp use spring models for undirected ones, circo arranges circular layouts and twopi radial ones — the same data looks completely different depending on which you pick.
Many output formats: PNG, SVG, PDF and PostScript among others. SVG output can carry links and tooltips, so it drops straight into a web page.
Command line driven: One dot -Tpng call produces the image, which makes it easy to wire into a build script, a docs pipeline or a Makefile so the diagrams regenerate alongside the source.
Widely embedded: Plenty of analysis and documentation tools emit a DOT file and hand it to Graphviz to render, so installing it is what completes their diagram output.