Description
Standing up monitoring usually goes like this: install Prometheus, configure exporters, write scrape rules, install Grafana, import somebody else’s dashboard, then fix the metric names one by one because they do not match. By the time the first chart appears an afternoon is gone, and the incident you were chasing is long over.
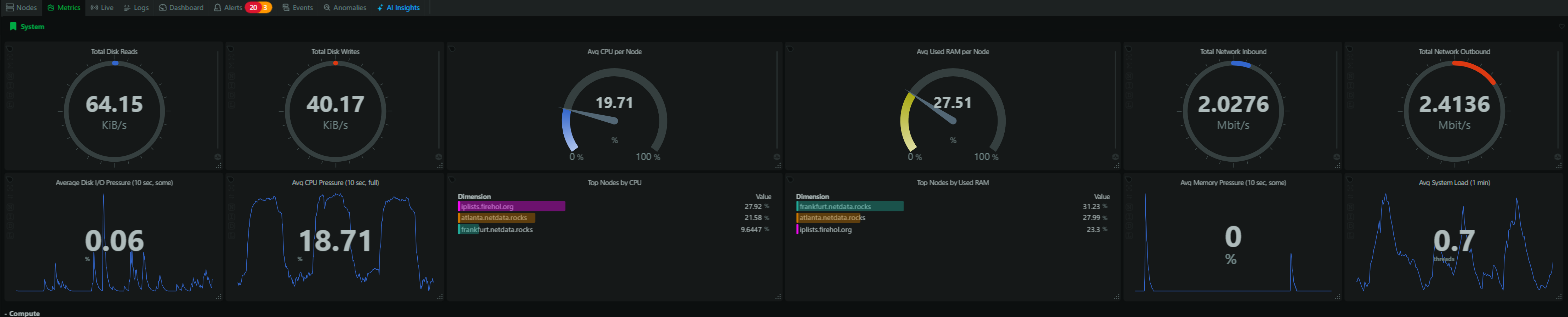
Netdata inverts that: charts appear the moment it is installed, with no configuration written. It discovers what is running on the machine by itself — CPU, memory, disks, interfaces, containers, databases, nginx — across 800+ integrations, samples at one-second resolution, and serves a complete dashboard at
For alerting it does not ask you to guess thresholds. It trains multiple machine-learning models per metric on the node itself, learning that metric’s own recent baseline, then flags anomalies unsupervised. The dashboard has an Anomaly Advisor page that plots the anomaly rate over time so you can highlight a window and see which metrics misbehaved in it. Training and inference both happen on the monitored machine — metrics never have to leave it.
On footprint the project publishes roughly 5% CPU and 150 MiB RAM in the default configuration, dropping under 1% CPU and about 100 MiB with ML and alerts disabled on ephemeral storage. Storage runs about 0.5 bytes per sample across per-second, per-minute and per-hour tiers, chosen automatically by zoom level, with data flushed to disk only every 17 minutes. A 2023 ICSOC paper from the University of Amsterdam measured it as the most energy-efficient tool for monitoring Docker-based systems.
Zero-configuration discovery: 800+ integrations covering systems, containers, VMs, hardware sensors, logs, OpenMetrics and StatsD, most of which chart themselves on install.
Per-second resolution: collection and display both run once a second with one-second chart latency — not a point per minute.
Edge-based ML anomaly detection: multiple models trained per metric on the node from historical behaviour, with an Anomaly Advisor for root-cause and blast-radius analysis, and no thresholds to set.
Tiered storage: about 0.5 bytes per sample across per-second, per-minute and per-hour tiers, queried automatically by zoom level — retention is limited only by disk.
No query language: the NIDL data model auto-generates dashboards, and you slice by dimension, node and instance directly on the chart instead of writing PromQL.
Logs too: direct systemd-journald integration on Linux and Windows Event Log plus ETW on Windows, processed at the edge and visualised; on Linux it also shows live TCP and UDP sockets per process.
Horizontal scale: Parent-Child streaming centralises metrics from many nodes for long retention and unified dashboards, with Parents handling millions of samples per second on suitable hardware.
Alerts and notifications: hundreds of preconfigured alert rules, delivered through email, Slack, Telegram, PagerDuty, Discord, Microsoft Teams and more.
Exports elsewhere: metrics can be shipped to Prometheus, InfluxDB, OpenTSDB or Graphite, and an API serves third-party dashboards.
Platforms: Linux, FreeBSD, macOS and Windows, plus Docker and Kubernetes deployments; on Linux it also watches hardware-level errors from GPUs, PCI AER, RAM EDAC, IPMI, S.M.A.R.T, NVMe, fans and voltage rails.
Read the licences separately: the Agent — the bulk of this repository — is GPL-3.0+, but the Netdata UI ships under the company’s own NCUL1 licence, which is not an open-source licence, and Netdata Cloud is an optional commercial service. Your data stays on your own machines by default; Cloud is not required.
Netdata inverts that: charts appear the moment it is installed, with no configuration written. It discovers what is running on the machine by itself — CPU, memory, disks, interfaces, containers, databases, nginx — across 800+ integrations, samples at one-second resolution, and serves a complete dashboard at
http://localhost:19999 with one second of latency between data and chart.For alerting it does not ask you to guess thresholds. It trains multiple machine-learning models per metric on the node itself, learning that metric’s own recent baseline, then flags anomalies unsupervised. The dashboard has an Anomaly Advisor page that plots the anomaly rate over time so you can highlight a window and see which metrics misbehaved in it. Training and inference both happen on the monitored machine — metrics never have to leave it.
On footprint the project publishes roughly 5% CPU and 150 MiB RAM in the default configuration, dropping under 1% CPU and about 100 MiB with ML and alerts disabled on ephemeral storage. Storage runs about 0.5 bytes per sample across per-second, per-minute and per-hour tiers, chosen automatically by zoom level, with data flushed to disk only every 17 minutes. A 2023 ICSOC paper from the University of Amsterdam measured it as the most energy-efficient tool for monitoring Docker-based systems.
Features
Zero-configuration discovery: 800+ integrations covering systems, containers, VMs, hardware sensors, logs, OpenMetrics and StatsD, most of which chart themselves on install.
Per-second resolution: collection and display both run once a second with one-second chart latency — not a point per minute.
Edge-based ML anomaly detection: multiple models trained per metric on the node from historical behaviour, with an Anomaly Advisor for root-cause and blast-radius analysis, and no thresholds to set.
Tiered storage: about 0.5 bytes per sample across per-second, per-minute and per-hour tiers, queried automatically by zoom level — retention is limited only by disk.
No query language: the NIDL data model auto-generates dashboards, and you slice by dimension, node and instance directly on the chart instead of writing PromQL.
Logs too: direct systemd-journald integration on Linux and Windows Event Log plus ETW on Windows, processed at the edge and visualised; on Linux it also shows live TCP and UDP sockets per process.
Horizontal scale: Parent-Child streaming centralises metrics from many nodes for long retention and unified dashboards, with Parents handling millions of samples per second on suitable hardware.
Alerts and notifications: hundreds of preconfigured alert rules, delivered through email, Slack, Telegram, PagerDuty, Discord, Microsoft Teams and more.
Exports elsewhere: metrics can be shipped to Prometheus, InfluxDB, OpenTSDB or Graphite, and an API serves third-party dashboards.
Platforms: Linux, FreeBSD, macOS and Windows, plus Docker and Kubernetes deployments; on Linux it also watches hardware-level errors from GPUs, PCI AER, RAM EDAC, IPMI, S.M.A.R.T, NVMe, fans and voltage rails.
Read the licences separately: the Agent — the bulk of this repository — is GPL-3.0+, but the Netdata UI ships under the company’s own NCUL1 licence, which is not an open-source licence, and Netdata Cloud is an optional commercial service. Your data stays on your own machines by default; Cloud is not required.