Description
Your Mac stutters, you open Activity Monitor, and what you see is *now* — the stutter already happened. Working out why the fans spun up yesterday afternoon, or which process drained the memory, is impossible because nothing kept a record. Activity Monitor is a live view with no history behind it.
Mac Performance Monitor supplies that history. It sits in the menu bar and writes metrics continuously into a local SQLite database — memory pressure, CPU, GPU, network, disk, battery, and how much each process is using. When the problem recurs, you can wind the timeline back and see what the machine was actually doing.
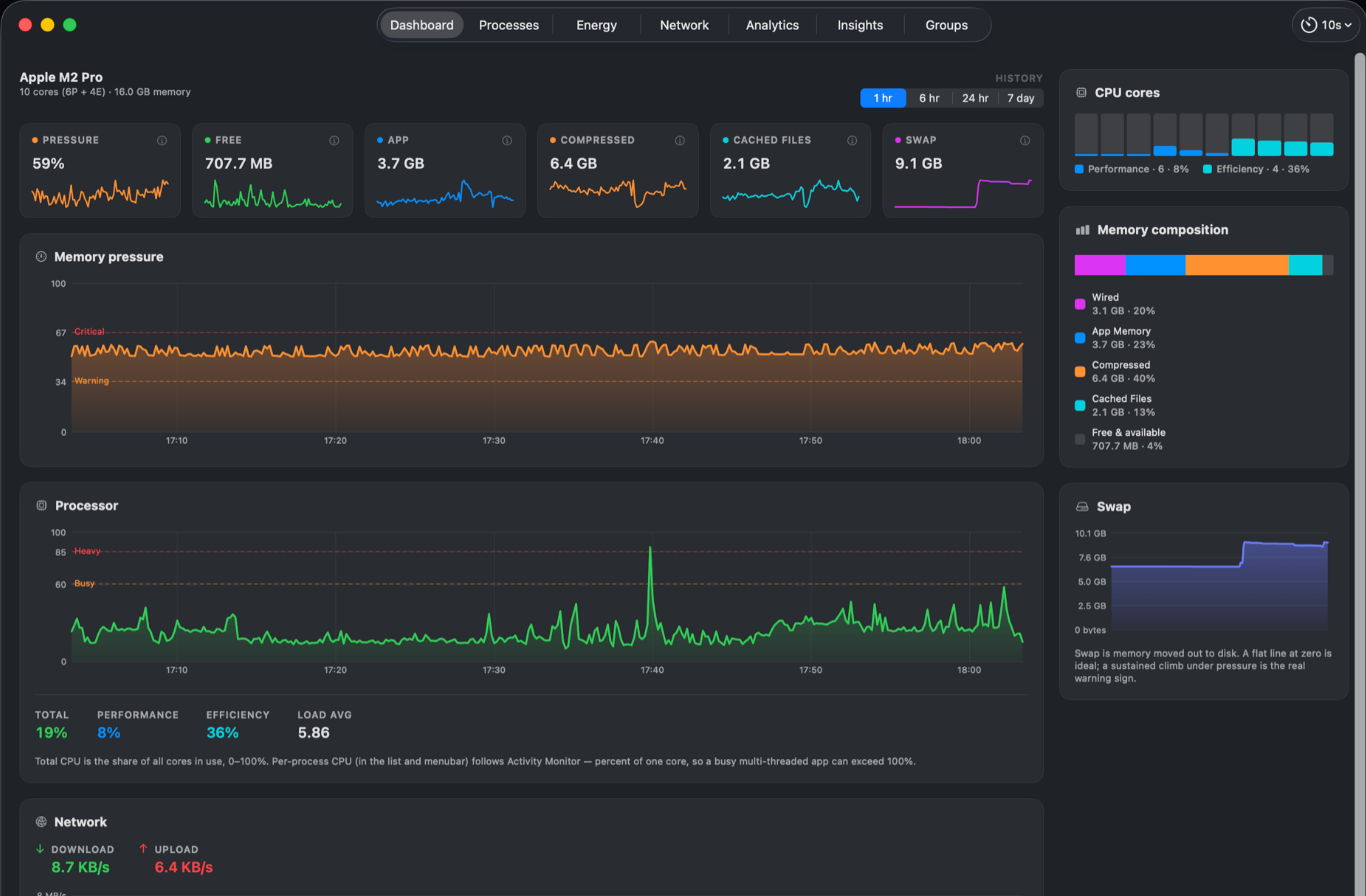
The interface offers 1 hour, 6 hour, 24 hour and 7 day ranges. Memory pressure and CPU are plotted with warning thresholds, alongside per-core GPU load, a memory breakdown (wired, app, compressed, cached, free) and a swap trend — a swap line that keeps climbing is usually the real sign that memory is short, and the app spells out that kind of reading next to the chart.
It is a native Swift application, MIT licensed, with no telemetry and all data kept on the machine. It needs Apple silicon and macOS 15 or later, and the build is signed and notarised by Apple, downloaded straight from GitHub.
Long-term local logging: Metrics are written continuously to a SQLite database on the machine, so history can be reviewed afterwards rather than vanishing with the live readout.
Broad coverage: Memory pressure, CPU, GPU, network, disk and battery are all recorded, along with per-process usage.
Selectable time ranges: Switch between 1 hour, 6 hour, 24 hour and 7 day windows to find the moment the problem occurred.
Memory in detail: Memory is broken into wired, app, compressed, cached files and free, shown alongside the swap trend so you can tell whether it is genuinely running short.
It explains: Beyond drawing charts it interprets what they show — for instance that a flat swap line at zero is healthy while a sustained climb is the warning sign.
Per-process investigation: Separate process and energy views help pin down which application is consuming the resources.
Lives in the menu bar: Key figures sit in the menu bar, so nothing needs to be kept open and watched.
No telemetry: Everything stays on the machine; the application sends nothing out.
Mac Performance Monitor supplies that history. It sits in the menu bar and writes metrics continuously into a local SQLite database — memory pressure, CPU, GPU, network, disk, battery, and how much each process is using. When the problem recurs, you can wind the timeline back and see what the machine was actually doing.
The interface offers 1 hour, 6 hour, 24 hour and 7 day ranges. Memory pressure and CPU are plotted with warning thresholds, alongside per-core GPU load, a memory breakdown (wired, app, compressed, cached, free) and a swap trend — a swap line that keeps climbing is usually the real sign that memory is short, and the app spells out that kind of reading next to the chart.
It is a native Swift application, MIT licensed, with no telemetry and all data kept on the machine. It needs Apple silicon and macOS 15 or later, and the build is signed and notarised by Apple, downloaded straight from GitHub.
Features
Long-term local logging: Metrics are written continuously to a SQLite database on the machine, so history can be reviewed afterwards rather than vanishing with the live readout.
Broad coverage: Memory pressure, CPU, GPU, network, disk and battery are all recorded, along with per-process usage.
Selectable time ranges: Switch between 1 hour, 6 hour, 24 hour and 7 day windows to find the moment the problem occurred.
Memory in detail: Memory is broken into wired, app, compressed, cached files and free, shown alongside the swap trend so you can tell whether it is genuinely running short.
It explains: Beyond drawing charts it interprets what they show — for instance that a flat swap line at zero is healthy while a sustained climb is the warning sign.
Per-process investigation: Separate process and energy views help pin down which application is consuming the resources.
Lives in the menu bar: Key figures sit in the menu bar, so nothing needs to be kept open and watched.
No telemetry: Everything stays on the machine; the application sends nothing out.