Description
< #Financial Data #Quantitative Research #Python #Data Interface #A-Share Data #Open Source
The annoying part of quantitative research is rarely the model — it is where the data comes from: one page from East Money, a section from Sina Finance, another file from the exchange, and the will to continue is gone before the copying into a spreadsheet is done. AKShare collects those public financial sources behind one set of Python interfaces, where a single function call returns a pandas DataFrame ready to work with.
Coverage spans stocks, futures, options, funds, foreign exchange, bonds, indices and macroeconomic series, and for common data such as A-share daily bars the documentation example runs as-is. The project is explicit about its scope: public sources, aimed at academic and personal research, not a replacement for a market data terminal.
One line per dataset: a call like `ak.stock_zh_a_hist(symbol="000001", period="daily", ...)` returns a DataFrame with date, OHLC, volume, change percentage and turnover, ready for the rest of a pandas pipeline.
Broad asset coverage: stocks, futures, options, funds, FX, bonds, indices, macroeconomic and alternative data all have interfaces, so each asset class does not need its own library.
Searchable interface registry: an offline registry ships with the package, so `ak.search("可转债 实时行情")` lists candidate interfaces without a network request, and `ak.interface_info()` returns parameters, output columns and a usage example — handy when an LLM has to resolve a description into a callable name.
Usable without Python: the companion AKTools project exposes the same interfaces over HTTP, so other languages and tools can fetch the data through a URL.
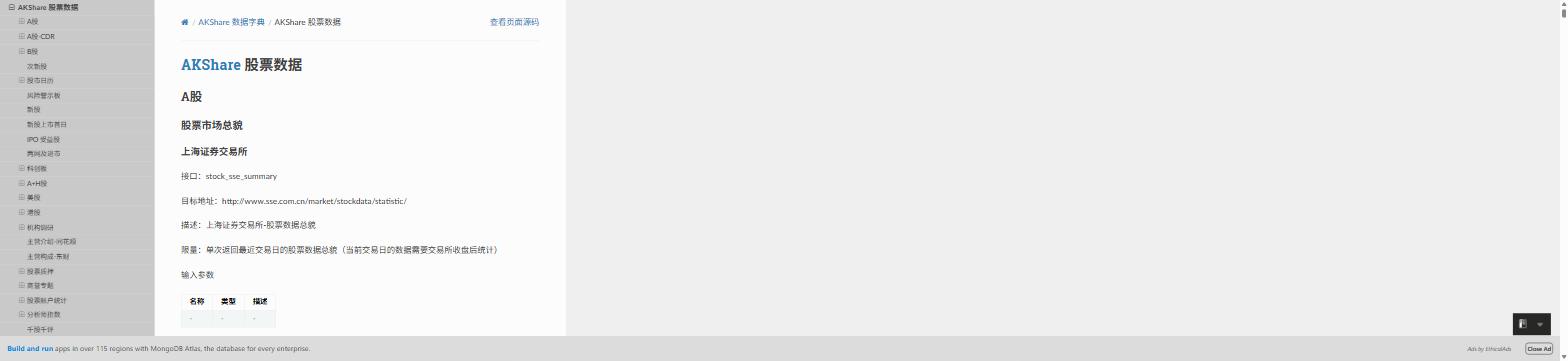
Documentation with a data dictionary: every interface is documented with its target source, field descriptions, rate limits and sample code, so checking a column does not mean reading the source.
Docker image ready: an official image with Jupyter is published, so a container is enough to start writing code without setting up a local environment.
Plots directly: because the output is a standard DataFrame, a few lines with mplfinance produce a candlestick chart with moving averages and volume.
Sources kept up to date: interfaces break when a site is redesigned — normal for this kind of library — and the project releases often, so upgrading is usually less work than maintaining your own scrapers.
Open source project: the source code is hosted on GitHub, so developers can review the implementation, contribute, or customize it for their own needs.
The annoying part of quantitative research is rarely the model — it is where the data comes from: one page from East Money, a section from Sina Finance, another file from the exchange, and the will to continue is gone before the copying into a spreadsheet is done. AKShare collects those public financial sources behind one set of Python interfaces, where a single function call returns a pandas DataFrame ready to work with.
Coverage spans stocks, futures, options, funds, foreign exchange, bonds, indices and macroeconomic series, and for common data such as A-share daily bars the documentation example runs as-is. The project is explicit about its scope: public sources, aimed at academic and personal research, not a replacement for a market data terminal.
Features
One line per dataset: a call like `ak.stock_zh_a_hist(symbol="000001", period="daily", ...)` returns a DataFrame with date, OHLC, volume, change percentage and turnover, ready for the rest of a pandas pipeline.
Broad asset coverage: stocks, futures, options, funds, FX, bonds, indices, macroeconomic and alternative data all have interfaces, so each asset class does not need its own library.
Searchable interface registry: an offline registry ships with the package, so `ak.search("可转债 实时行情")` lists candidate interfaces without a network request, and `ak.interface_info()` returns parameters, output columns and a usage example — handy when an LLM has to resolve a description into a callable name.
Usable without Python: the companion AKTools project exposes the same interfaces over HTTP, so other languages and tools can fetch the data through a URL.
Documentation with a data dictionary: every interface is documented with its target source, field descriptions, rate limits and sample code, so checking a column does not mean reading the source.
Docker image ready: an official image with Jupyter is published, so a container is enough to start writing code without setting up a local environment.
Plots directly: because the output is a standard DataFrame, a few lines with mplfinance produce a candlestick chart with moving averages and volume.
Sources kept up to date: interfaces break when a site is redesigned — normal for this kind of library — and the project releases often, so upgrading is usually less work than maintaining your own scrapers.
Open source project: the source code is hosted on GitHub, so developers can review the implementation, contribute, or customize it for their own needs.