Description
#Server Monitoring #Open Source Software #Self-Hosted #Operations Tool #Status Monitoring #Docker Deployment #Visual Dashboard
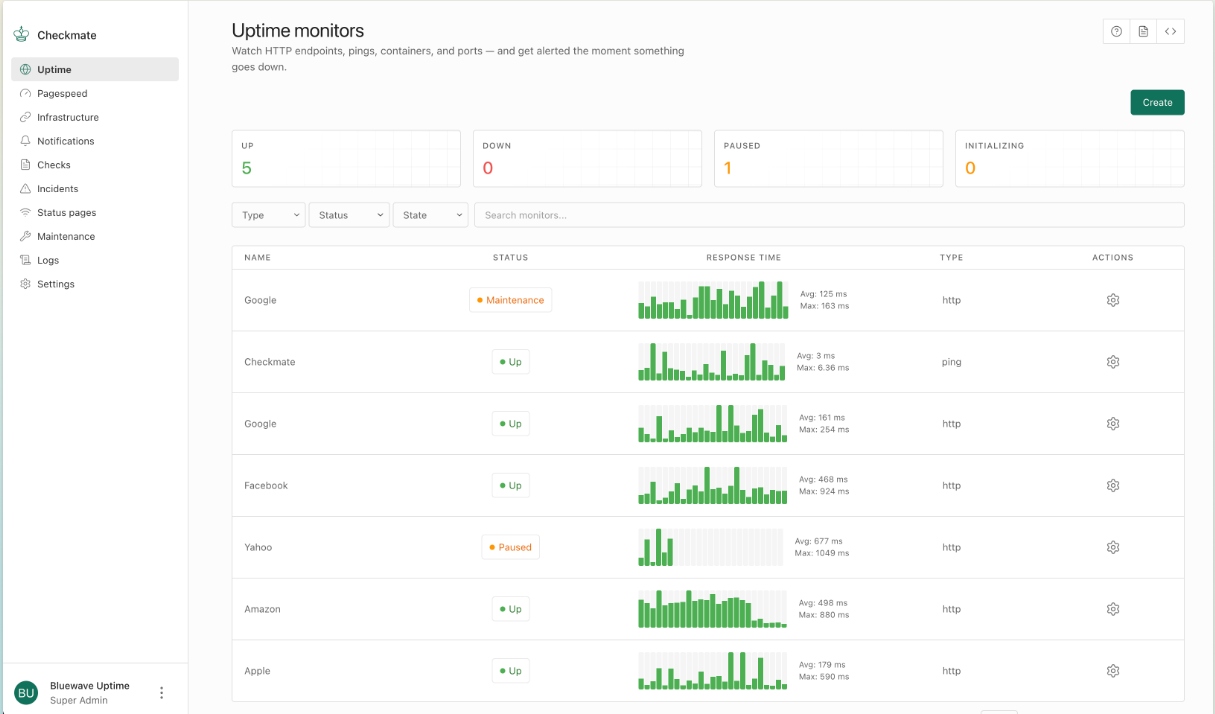
Checkmate is an open-source server and website status monitoring tool developed by BlueWave Labs, focusing on lightweight deployment, real-time monitoring, and a visually appealing dashboard. It allows you to view the server's operational status, resource usage, uptime, response latency, and fault alerts all in one place, eliminating the need to pay high subscription fees for commercial monitoring platforms.
This tool supports complete self-deployment, with monitoring data stored on your own server, avoiding the need to upload to third-party cloud platforms. For individual developers, small teams, and operations personnel, it effectively packages complex monitoring capabilities into a ready-to-use modern dashboard.
Server Status Monitoring: Centrally view the online status, operational condition, and key resource data of servers, making it easy to quickly ascertain whether devices are functioning properly.
Website Availability Testing: Regularly check if websites or services are accessible, recording uptime, response times, and any abnormal statuses.
Response Latency Monitoring: Continuously track service response speed, identifying issues such as slow access or network fluctuations through real-time data and historical trends.
Fault Alerts: Notifications can be triggered promptly when servers go offline, websites become inaccessible, or responses are abnormal, reducing fault discovery time.
Resource Usage Display: View the usage of hardware resources such as CPU, memory, and disk through a visual dashboard, quickly locating performance bottlenecks.
Modern Dashboard: The interface features a high-tech visual design, making real-time data, status information, and monitoring results clear at a glance, moving away from the outdated and complex operation interfaces of traditional monitoring tools.
Historical Data Analysis: Supports viewing trends in monitoring data changes, facilitating analysis of server stability, fault frequency, and service performance.
Complete Self-Deployment: Both the program and monitoring data are managed by the user, eliminating the need to purchase cloud monitoring packages or share sensitive operational data with third-party platforms.
Lightweight Architecture: Overall deployment is relatively low-threshold, with friendly server configuration requirements, allowing personal projects and small environments to run easily.
Quick Installation: Using the deployment methods provided by the official, installation and startup can be completed in a short time, without the need to build complex monitoring components like Grafana from scratch.
Checkmate is an open-source server and website status monitoring tool developed by BlueWave Labs, focusing on lightweight deployment, real-time monitoring, and a visually appealing dashboard. It allows you to view the server's operational status, resource usage, uptime, response latency, and fault alerts all in one place, eliminating the need to pay high subscription fees for commercial monitoring platforms.
This tool supports complete self-deployment, with monitoring data stored on your own server, avoiding the need to upload to third-party cloud platforms. For individual developers, small teams, and operations personnel, it effectively packages complex monitoring capabilities into a ready-to-use modern dashboard.
Software Features
Server Status Monitoring: Centrally view the online status, operational condition, and key resource data of servers, making it easy to quickly ascertain whether devices are functioning properly.
Website Availability Testing: Regularly check if websites or services are accessible, recording uptime, response times, and any abnormal statuses.
Response Latency Monitoring: Continuously track service response speed, identifying issues such as slow access or network fluctuations through real-time data and historical trends.
Fault Alerts: Notifications can be triggered promptly when servers go offline, websites become inaccessible, or responses are abnormal, reducing fault discovery time.
Resource Usage Display: View the usage of hardware resources such as CPU, memory, and disk through a visual dashboard, quickly locating performance bottlenecks.
Modern Dashboard: The interface features a high-tech visual design, making real-time data, status information, and monitoring results clear at a glance, moving away from the outdated and complex operation interfaces of traditional monitoring tools.
Historical Data Analysis: Supports viewing trends in monitoring data changes, facilitating analysis of server stability, fault frequency, and service performance.
Complete Self-Deployment: Both the program and monitoring data are managed by the user, eliminating the need to purchase cloud monitoring packages or share sensitive operational data with third-party platforms.
Lightweight Architecture: Overall deployment is relatively low-threshold, with friendly server configuration requirements, allowing personal projects and small environments to run easily.
Quick Installation: Using the deployment methods provided by the official, installation and startup can be completed in a short time, without the need to build complex monitoring components like Grafana from scratch.