Description
#AI Quantitative Research #Stock Analysis #Open Source Project
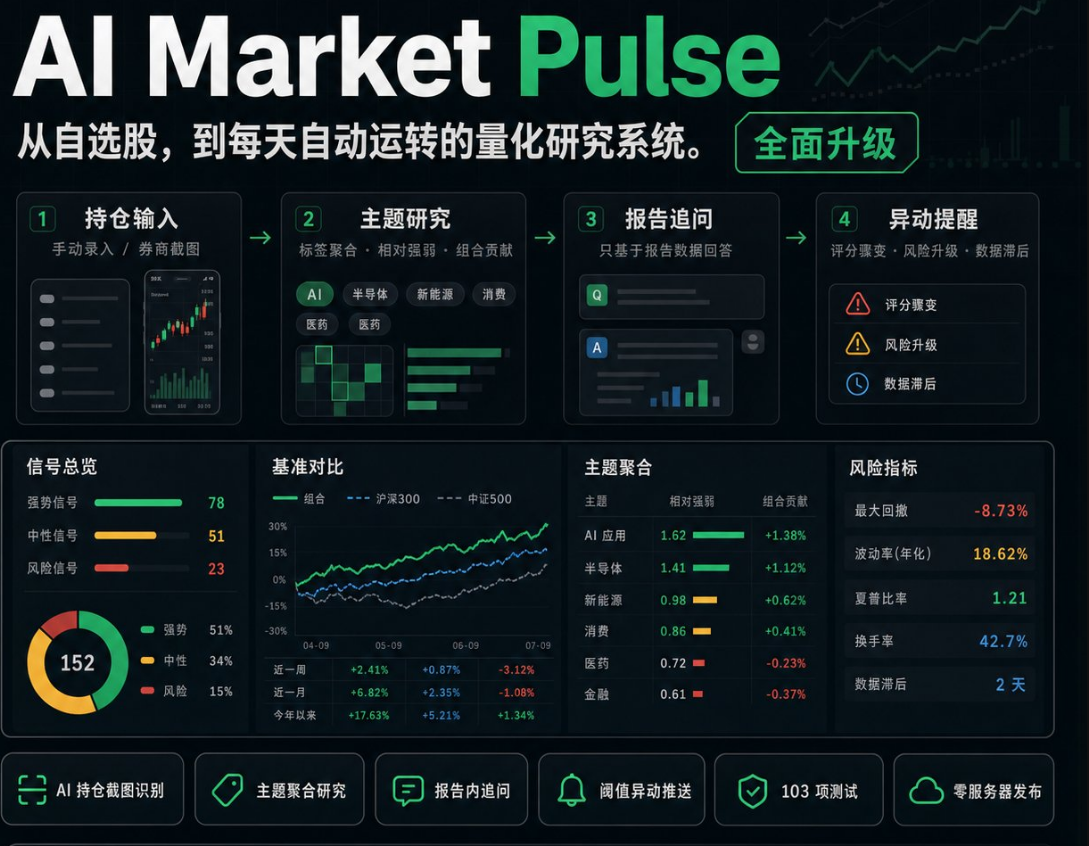
AI Market Pulse is a AI Stock Research Dashboard designed for individual investors and quantitative research users. It has evolved from an initial daily stock analysis script to an integrated research tool that covers position import, theme aggregation, rule scoring, benchmark comparison, report questioning, and anomaly alerts. The project is developed in Python, supports local execution, and can be published at low cost with zero server requirements through GitHub Pages, making it suitable for generating personalized watchlist daily reports and daily market research reports.
The project emphasizes open source, transparency, and reproducibility, allowing users to view and adjust the core research processes and scoring logic. Users can simply import their positions or add stocks to their watchlist to automatically organize market information, identify sector themes, analyze relative performance, and generate their own quantitative research daily reports. According to the project, there are currently 103 tests that have passed, making it suitable for developers and investment research users who wish to combine AI, rule-based strategies, and stock research processes.
Screenshot Position Import: Supports quick recognition of stocks and related information through position screenshots, reducing manual entry operations.
Watchlist Research: After importing the stocks of interest, personalized market analysis and research reports can be generated daily.
Theme Aggregation: Automatically summarizes the industry, concepts, and market themes of stocks, helping users understand the connections between their holdings.
Rule Scoring: Scores stocks based on preset or custom rules, making the analysis process more transparent and interpretable.
Benchmark Comparison: Compares individual stocks or portfolio combinations with relevant indices and industry benchmarks to observe relative strength and weakness.
AI Report Generation: Automatically generates structured quantitative research daily reports, summarizing market conditions, scores, themes, and anomalies.
Report Questioning: Allows users to continue questioning the generated research reports for further analysis of individual stocks, themes, or risk points.
Anomaly Alerts: Monitors changes in price, trading volume, scores, or other indicators, and alerts users to anomalies.
Local Execution: The core program can run in a local environment, allowing users to manage their data and research configurations independently.
GitHub Pages Publishing: Supports displaying daily reports through GitHub Pages, without the need for separate server deployment.
Open Source and Reproducible: Licensed under the MIT open source license, users can view the source code, modify rules, and conduct secondary development.
Automated Testing: According to the project, there are currently 103 tests that have passed to ensure the stability of core processes.
AI Market Pulse is a AI Stock Research Dashboard designed for individual investors and quantitative research users. It has evolved from an initial daily stock analysis script to an integrated research tool that covers position import, theme aggregation, rule scoring, benchmark comparison, report questioning, and anomaly alerts. The project is developed in Python, supports local execution, and can be published at low cost with zero server requirements through GitHub Pages, making it suitable for generating personalized watchlist daily reports and daily market research reports.
The project emphasizes open source, transparency, and reproducibility, allowing users to view and adjust the core research processes and scoring logic. Users can simply import their positions or add stocks to their watchlist to automatically organize market information, identify sector themes, analyze relative performance, and generate their own quantitative research daily reports. According to the project, there are currently 103 tests that have passed, making it suitable for developers and investment research users who wish to combine AI, rule-based strategies, and stock research processes.
Software Features
Screenshot Position Import: Supports quick recognition of stocks and related information through position screenshots, reducing manual entry operations.
Watchlist Research: After importing the stocks of interest, personalized market analysis and research reports can be generated daily.
Theme Aggregation: Automatically summarizes the industry, concepts, and market themes of stocks, helping users understand the connections between their holdings.
Rule Scoring: Scores stocks based on preset or custom rules, making the analysis process more transparent and interpretable.
Benchmark Comparison: Compares individual stocks or portfolio combinations with relevant indices and industry benchmarks to observe relative strength and weakness.
AI Report Generation: Automatically generates structured quantitative research daily reports, summarizing market conditions, scores, themes, and anomalies.
Report Questioning: Allows users to continue questioning the generated research reports for further analysis of individual stocks, themes, or risk points.
Anomaly Alerts: Monitors changes in price, trading volume, scores, or other indicators, and alerts users to anomalies.
Local Execution: The core program can run in a local environment, allowing users to manage their data and research configurations independently.
GitHub Pages Publishing: Supports displaying daily reports through GitHub Pages, without the need for separate server deployment.
Open Source and Reproducible: Licensed under the MIT open source license, users can view the source code, modify rules, and conduct secondary development.
Automated Testing: According to the project, there are currently 103 tests that have passed to ensure the stability of core processes.